Diagrams are the table around which we gather
As I spend more time as a designer, the more I suspect we’re each just a collection of well-worn mental models, frameworks, and favourite tools, held together with caffeine and tears. As designers, we’re exposed to different ways to solve problems; we try them out and those that help we keep around for another day.
Good design tools serve the designer. Or, perhaps more accurately, the goals of the designer. They’re ‘good’ if they allow us to explore the problem effectively, communicate with others, or evaluate a potential solution.
I’ve come to appreciate the value of diagrams as design tools and I’ve leaned on them to help communicate nuanced information simply to a wide variety of stakeholders. Not only does the act of creating an effective diagram force you to distill what you know down to the core elements, it also makes you think about who might be using the diagram and how to accommodate them.
It seems to me, a great diagram is one which is:
- simple; unnecessary visual complexity can be off-putting and overwhelming
- accessible; complexity aside, jargon and unfamiliarity can prevent someone from understanding and using the diagram
- flexible; able to expand a bit if those using it want to explore the problem space a bit (sometime this manifests as ambiguity in the diagram and simplicity can help with that)
- focused; the more concepts a diagram tries to capture or do, the less likely it is to be simple or accessible (a 30,000-foot view, architectural diagram’s scope may be significant…but hopefully the detail is greeked appropriately)
Over the past few years, I’ve used diagrams really effectively to work with folks across disciplines and design maturities to build a shared understanding and consensus around a way forward. In this way, they serve as a lingua franca for the team.
Diagrams as visual frameworks
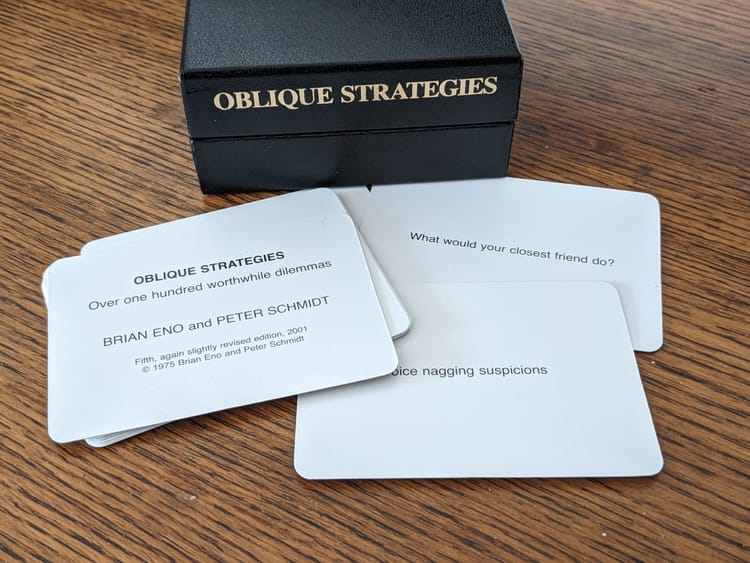
A few weeks ago, I received a parcel in the mail. It was Dave Gray’s Visual Frameworks card deck, which I’d supported recently on Kickstarter.
Dave Gray is a well-respected designer, perhaps best known for his thought leadership around visual thinking. He has written some amazing books, including one of my all-time favourites Gamestorming (with Sunni Brown and James Macanufo), and Liminal Thinking.
The deck is a curated set of visual frameworks. Gray introduces these, collectively, as “a language of patterns” that “could be used to explore any situation, start making sense of it, and build shared understanding” (Gray, 2023).
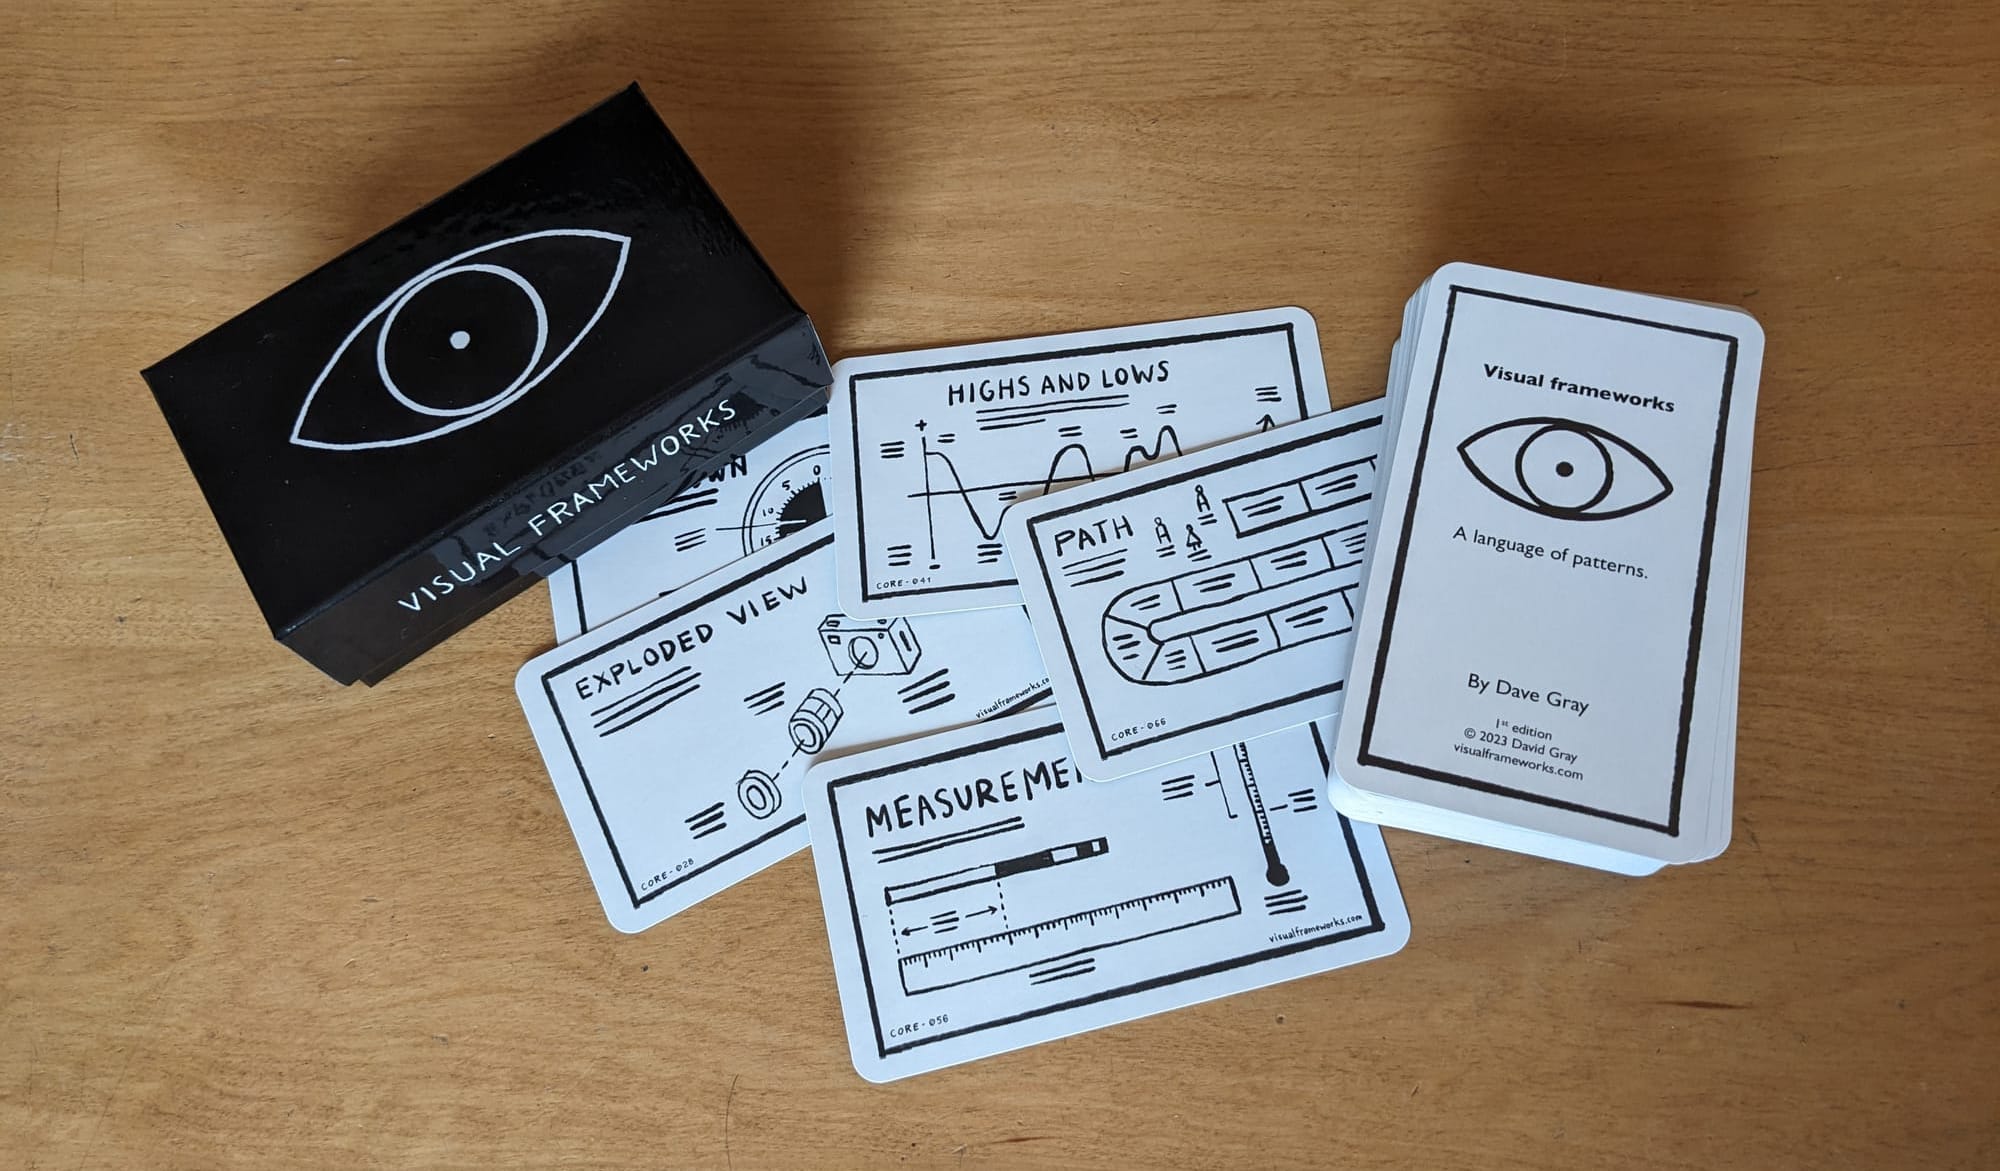
Heuristic collections or pattern libraries like this are a wonderful hack for design work. Their authors have surveyed, distilled, curated, and codified large bodies of research into a form factor that encourages use. And, as is the case with Visual Frameworks, cards decks are just plain fun.
Reconciliation is magic
The act of reconciliation—trying to determine if there is a ‘fit’ between the diagram and your design problem or task—is magic. It is during this stage that you find yourself saying things like “…but what about?”, “…does this make sense?”, and “…ooh, I didn't think of that!”. The mental act of identifying overlap, seeing where there are gaps, and generally relating two or more ‘things’ is productive friction.
When engaged in divergent thinking, I like to use the collections to remind me what I’ve missed or could use effectively. They help me explore the boundaries of a problem space—“The first step to taming any mess is to shine a light on it so you can outline its edges and depths” (Covert, 2014).
When practising convergent thinking, collections help me identify patterns I can use to simplify what I’m trying to communicate. In the same way we use patterns people may be familiar with in interaction design to act as semantic shortcuts, we can use visual patterns when creating a diagram.
The diagram can also be a proxy voice in the conversation ahead: stakeholders can identify something that they feel strongly about or relate to in the diagram as a way to voice an opinion about the problem or solution. Instead of having to explain everything they’re thinking, they can lean on parts of the diagram to help out. Bits of diagrams can even develop into hyper-localized jargon with the team (that’s the lingua franca bit I mentioned).
You’re really looking for the diagram to be the table a group can gather around, so they can explore a problem effectively and equitably.
Case study: Cones of uncertainty
I work for a deep tech company. We’re creating technology that is more foundational than incremental in nature, and whose commercial applications aren’t always straightforward.
I began looking for frameworks that could help us explore potential applications of this deep tech. The framework needed to be expansive enough to support us thinking about all the things you need to consider when building a new product or defining a new market category. But I also wanted the framework to help us to think more radically: take weak signals to their extreme; consider the impact of dramatic societal changes; explore dangerous or even evil misuses of the technology; consider two and three orders of magnitude, etc.
I also wanted the framework to help us to think more radically: take weak signals to their extreme; consider the impact of dramatic societal changes; explore dangerous or even evil misuses of the technology; consider two and three orders of magnitude, etc.
I remembered a scene from “Sneakers” (Robinson, 1992, 1:03), a fun movie about hacking of different sorts. There is a scene where two old friends talk about the potential of a piece of technology that can decrypt anything.
What I love about this scene is that Ben Kingsley’s character (with the ponytail and suit) describes what might be possible—not by just stating it outright—but by ‘ratcheting’ up his friend’s responses.
He quickly moves the conversation from collapsing local banks to destabilizing markets to bringing down the global concept of ownership. He re-calibrates the scale by pushing back and asking his friend to think bigger, faster.
This is the scale of thought experiment I wanted to tap into when using a framework to help explore what our deep tech could accomplish.
The design fiction rabbit hole 🕳️
For a few years now, I’ve been falling down the wonderful “design fiction” rabbit hole. Design fiction is “the practice of creating tangible and evocative prototypes from possible near futures to help discover and represent the consequences of decision making.” (Near Future Laboratory, 2022)
A great introductory video for design fiction put out by the Near Future Laboratory.
So while I won’t go into the physical artifacts I created to explore possible futures for the deep tech we’re creating, I did want to highlight one of the diagrams I came across during that work.
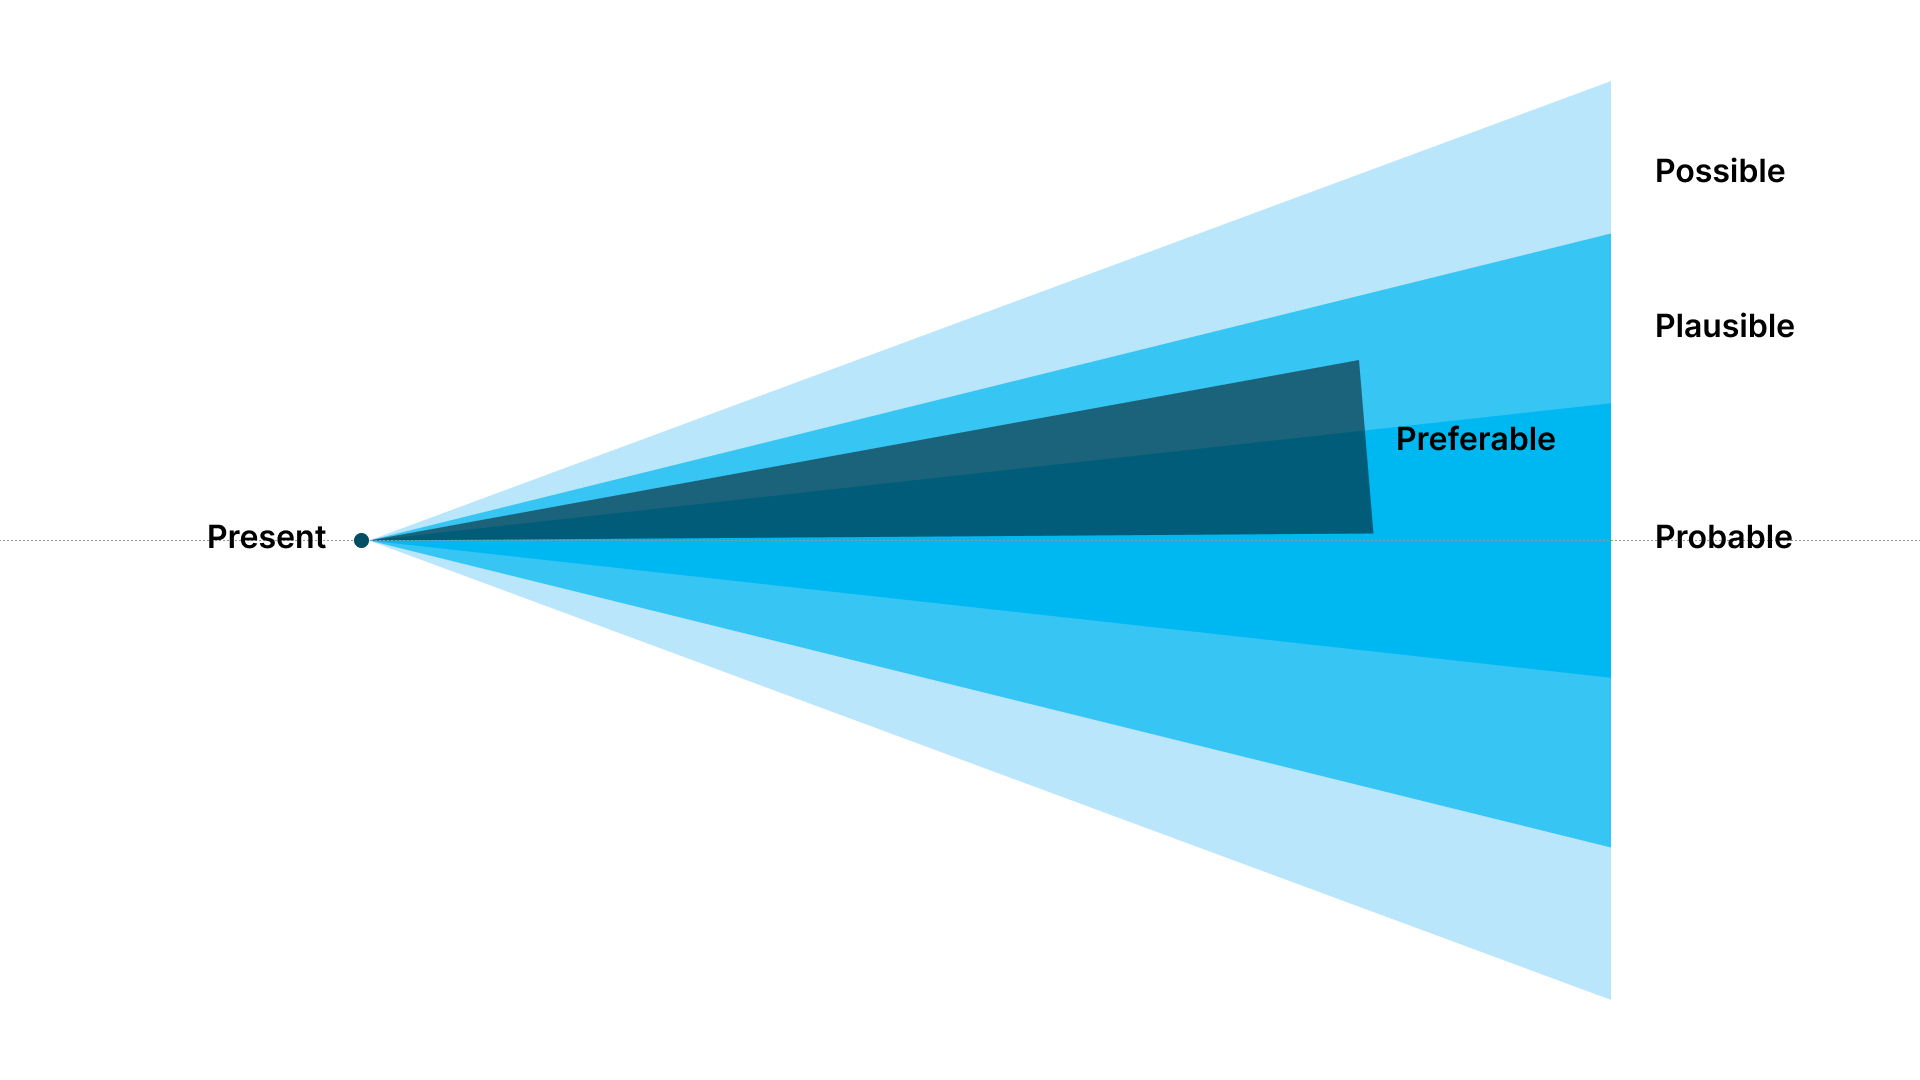
In Speculative Everything: Design, Fiction, and Social Dreaming, Anthony Dunne and Fiona Raby (2013) talk about a diagram they call ‘PPPP’, adapted from one proposed by futurist Stuart Candy.
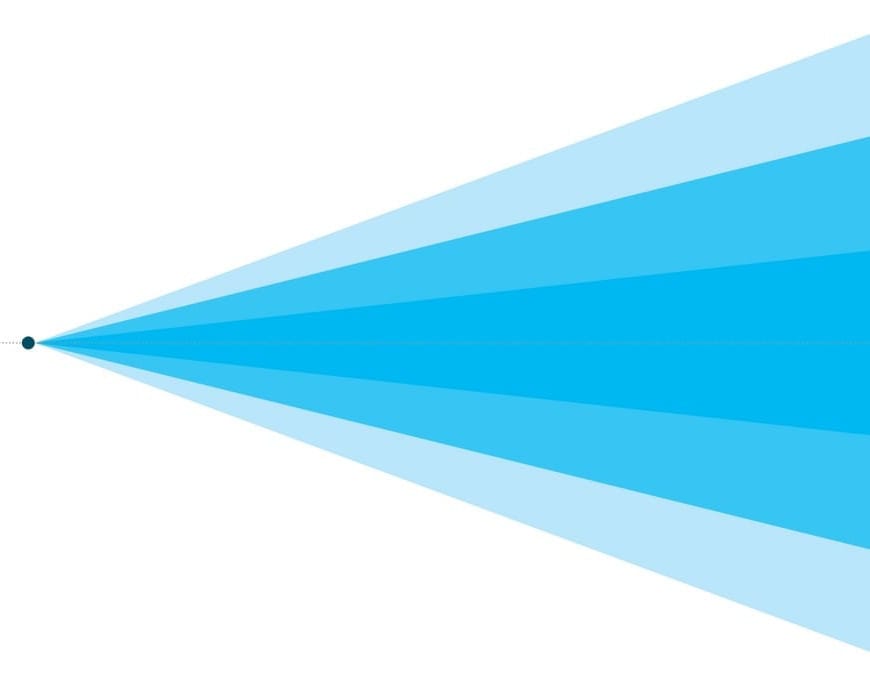
I’ve really enjoyed using this diagram over the past year or so, although I refer to it as “cones of uncertainty”. I introduce the diagram to folks by building it up from nothing.
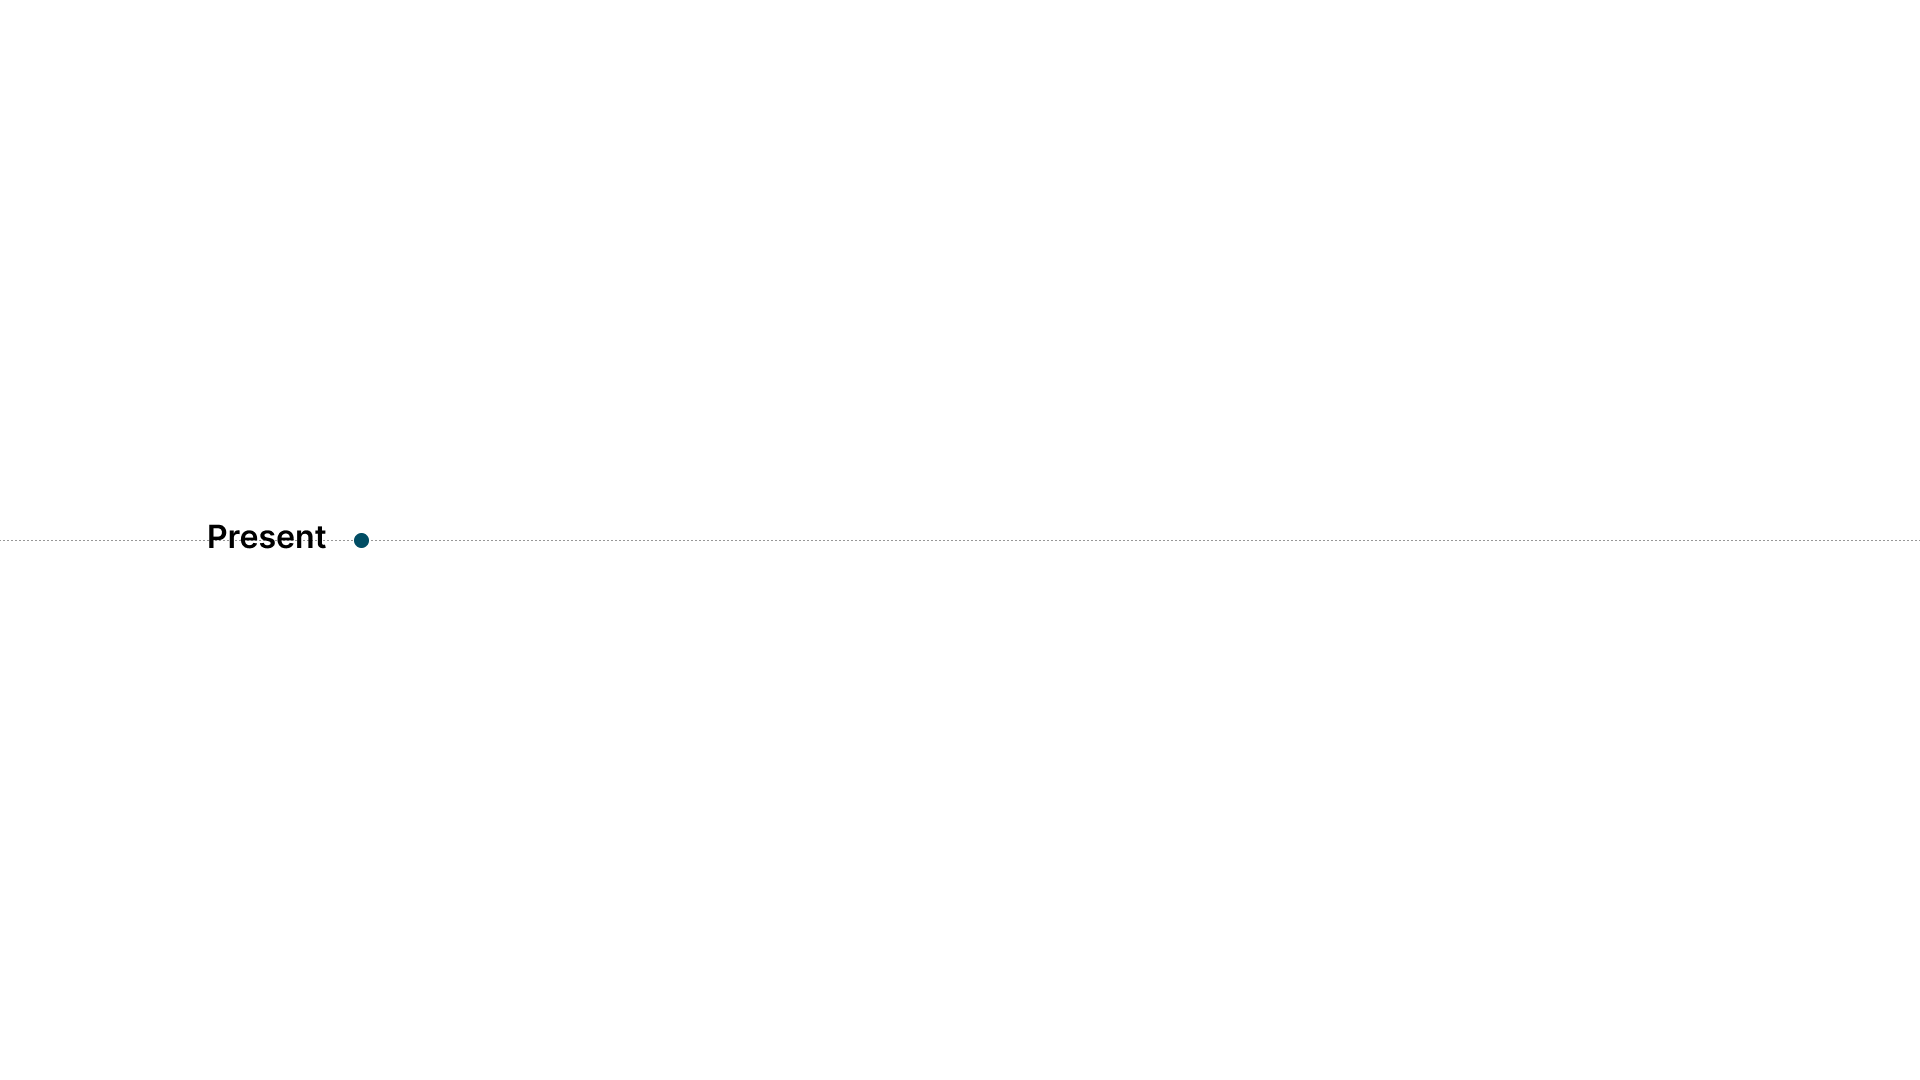
The present…
The first component is a lone dot, representing the present. As this diagram is largely about looking ahead, it doesn’t show the past (although contextualizing the discussion with some history helps, if only to reinforce why we’re using the diagram at all).

…with a timeline
Next, we draw a timeline. It extends from the past, through the present, and into the future. It is straight and I think of it as the status quo: what will happen if we don’t change course.
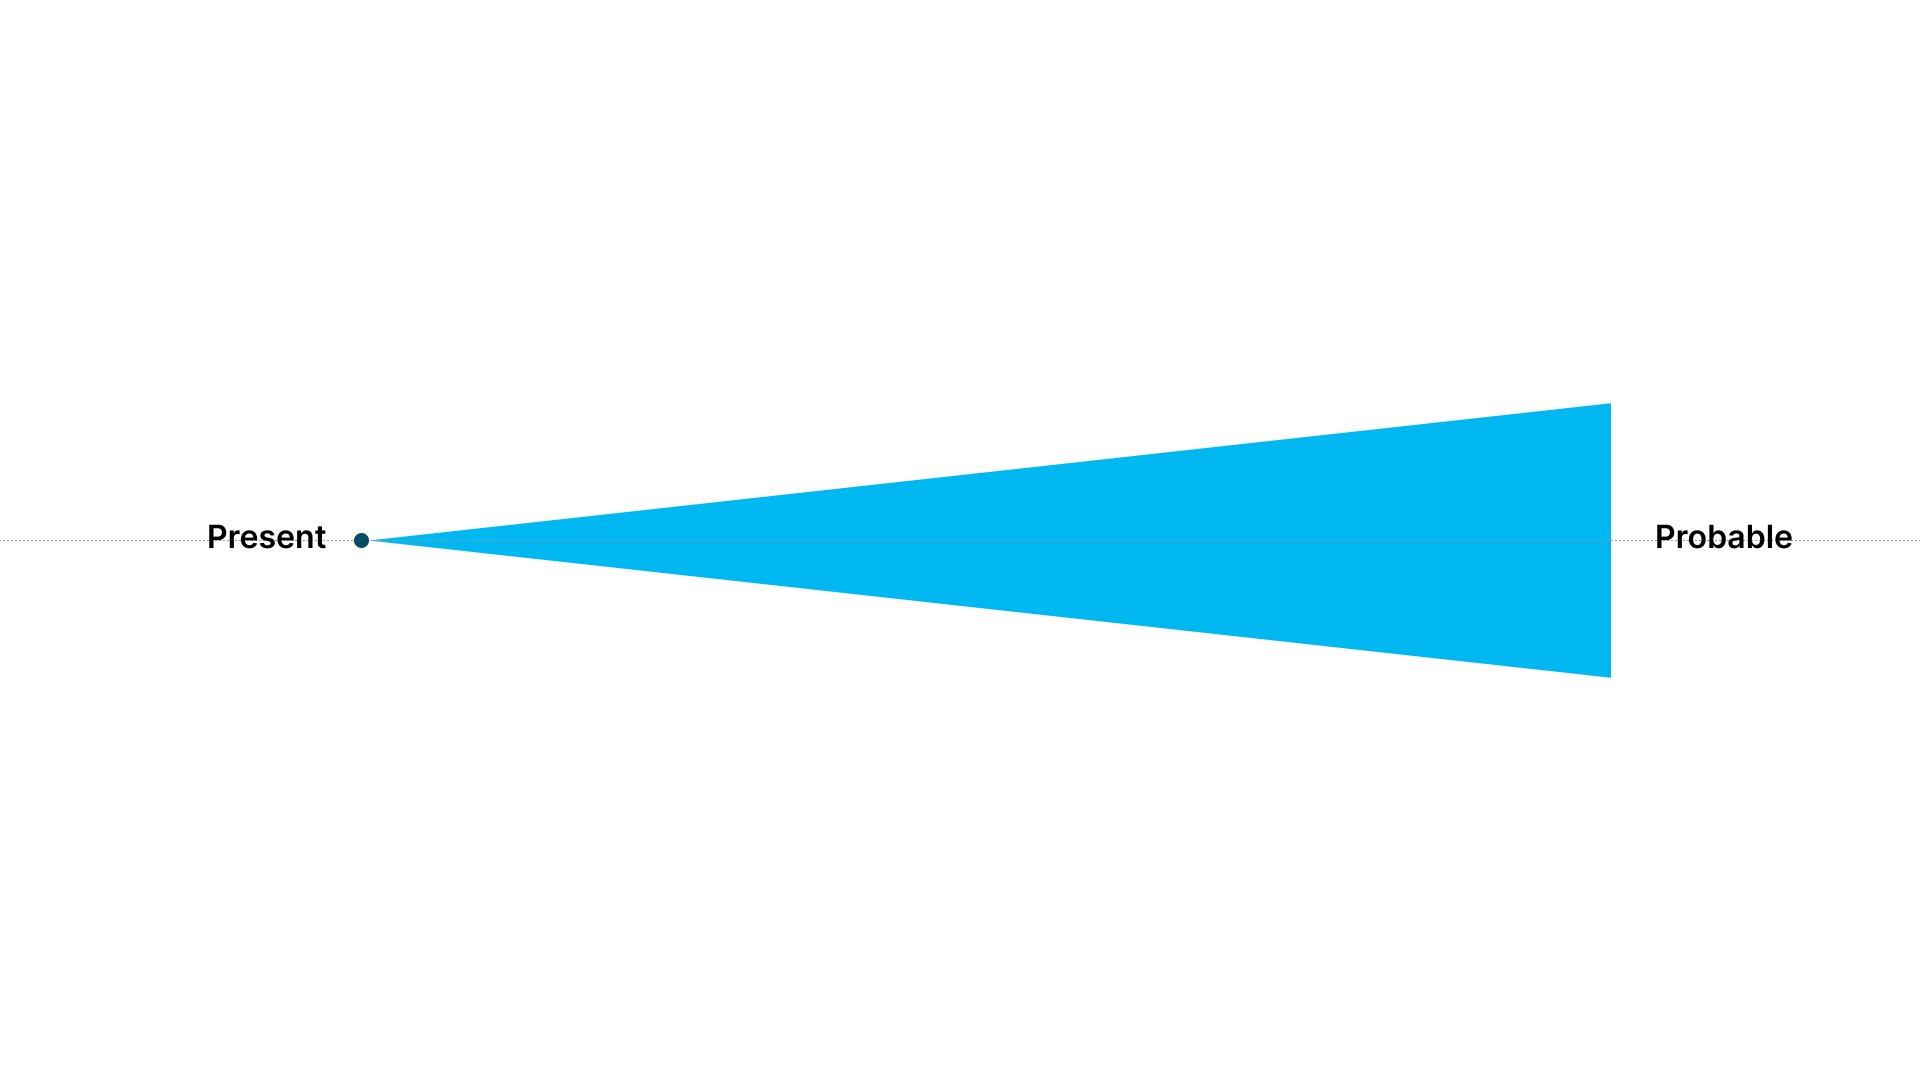
Next, we introduce the first of several cones. The first cone is the ‘probable’ cone.
The probable cone
The probable cone starts at the present (the dot) and radiates into the future, along the timeline we’ve just introduced. What’s interesting is that as time passes—in other words, as the cone extends into the future—the size of the cone increases.
This behaviour captures the nature of foresight and speculation: more than one thing can happen in the future and, as time goes on, the set of things that could happen grows.
If you’re a product designer working in established/mature corporate tech, you’re likely spending most of your time in the ‘probable’ cone.
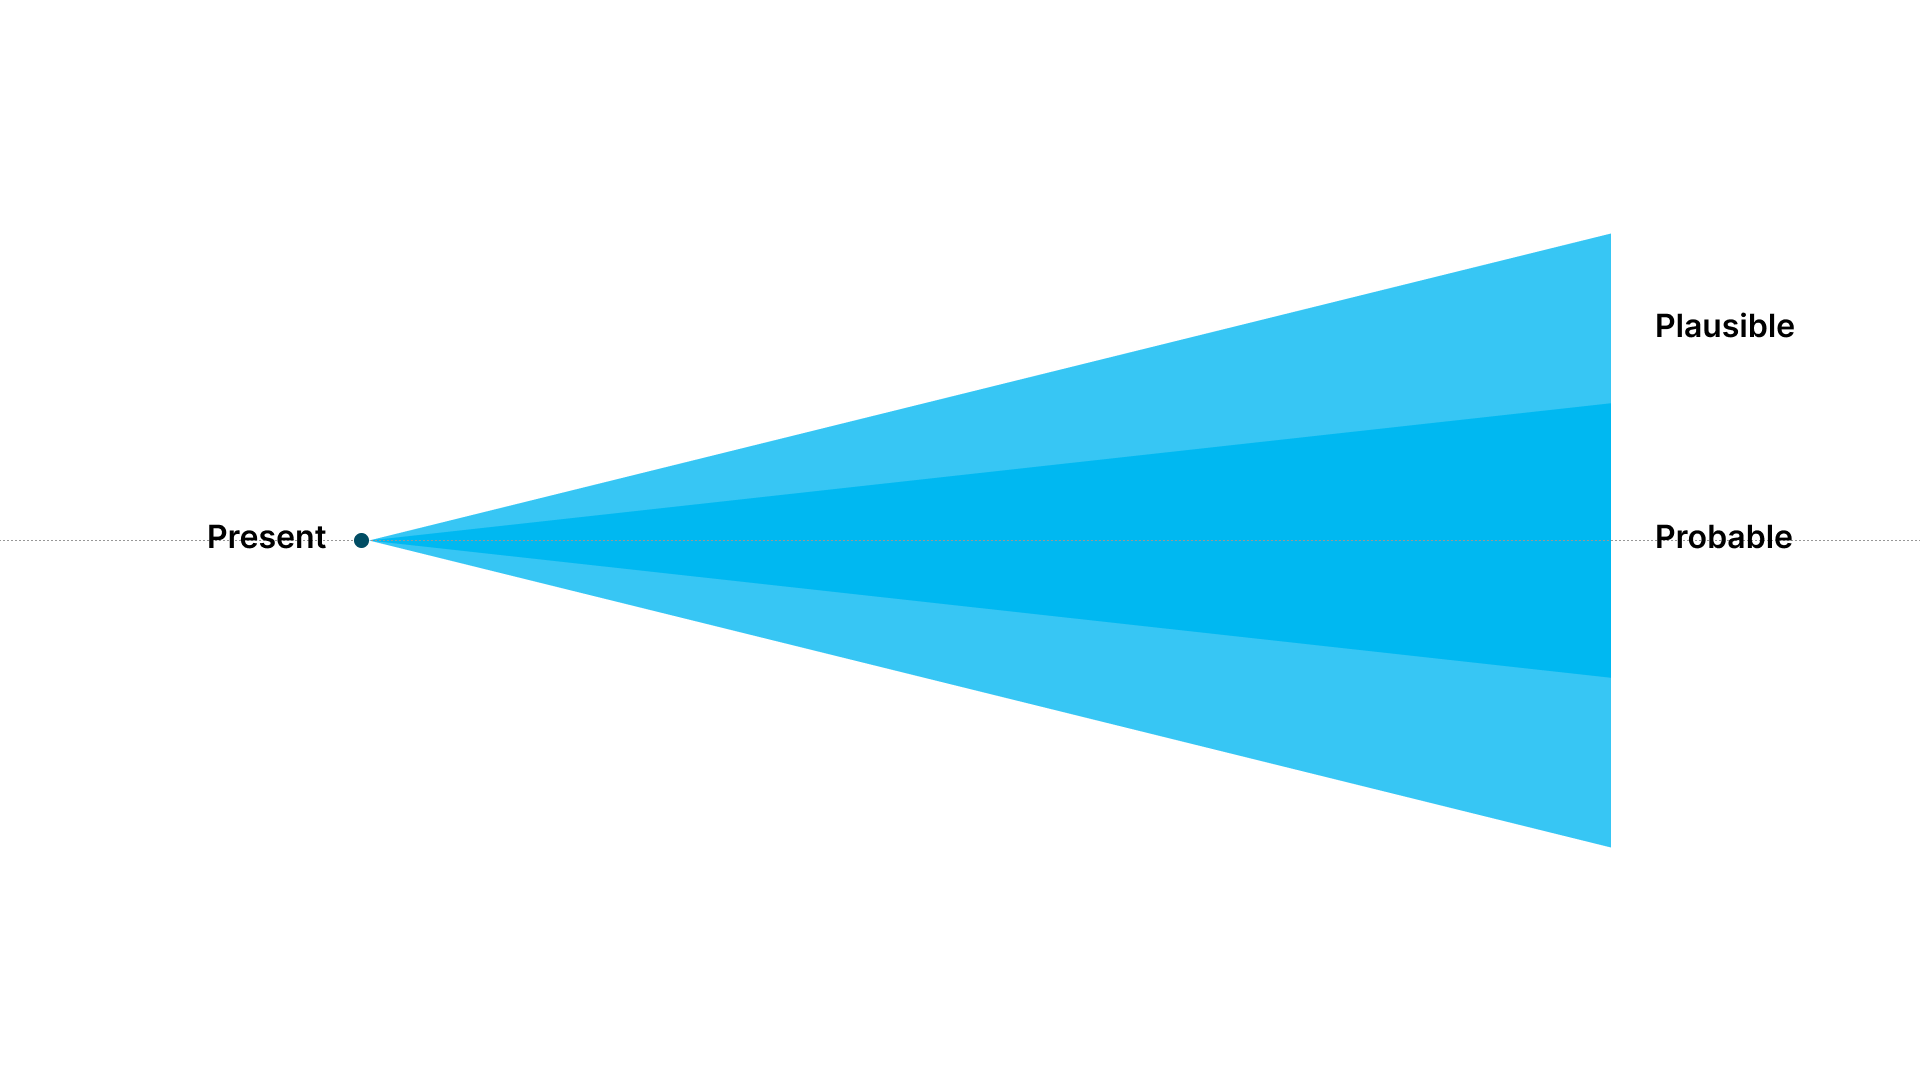
The plausible cone
The ‘plausible’ cone is next. Like the probable cone, it’s centred around the status quo timeline. But is it larger than the probable code.
If something is plausible, it means something could happen while if something is probable it means is is likely. You can see where this is going; as the likelihood constraint loosens, the set of possibilities increases.
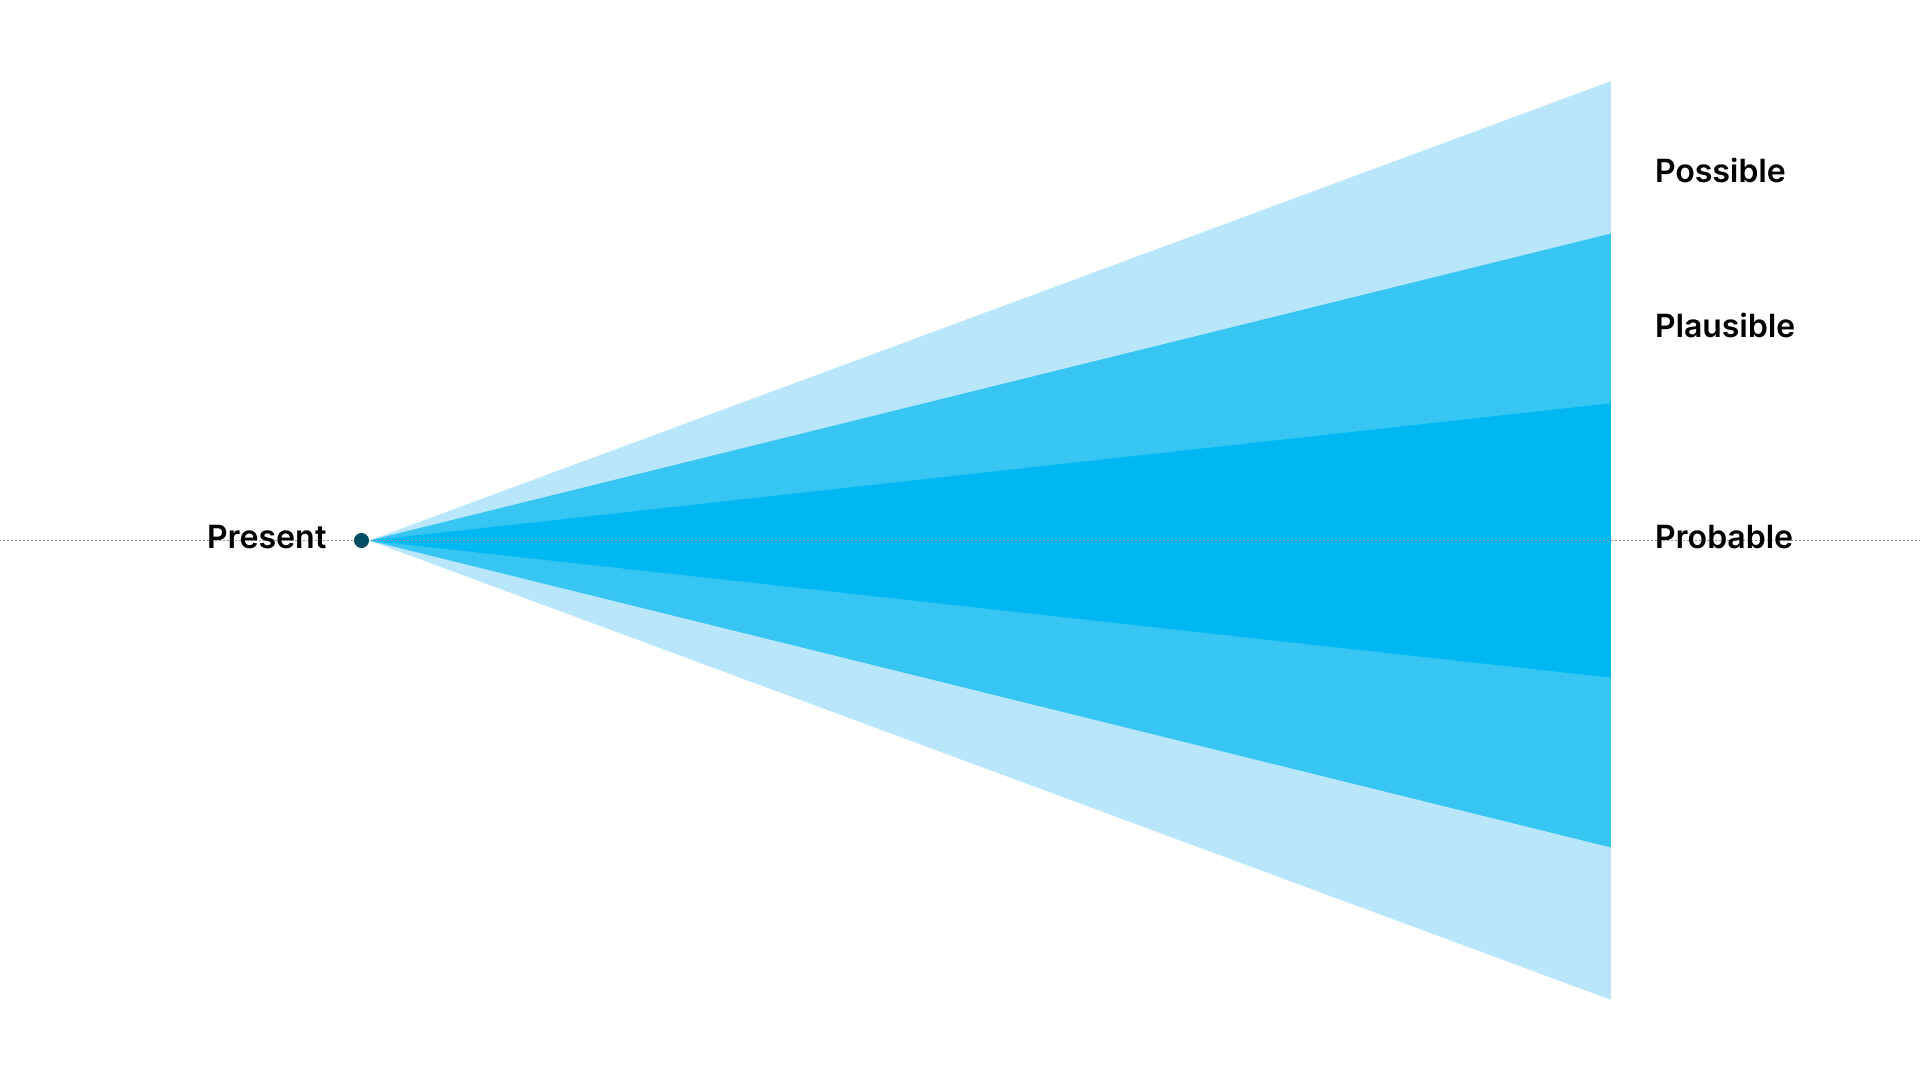
The possible cone
The next cone is the ‘possible’ cone. It captures things that are even less likely to happen than those in the plausible and probable cones. It is the widest cone, meaning there are a lot of things that are possible, fewer which are plausible, and even fewer are probable.
So, how do I use it?
At this point, we’ve established a series of terms and visualizations that relate conceivable futures.
The diagram presents two axes:
- time (horizontal, extending to the right)
- improbability (vertical, symmetric around the timeline)
And we’ve also introduced a way of breaking down the set of all futures using terms that are likely familiar to folks:
- those that are probable (most likely to occur)
- those that are plausible (less likely to occur than the probable set of outcomes)
- those that are possible (less likely to occur than both the probable and plausible sets)
These are the “rules of the game”, so to speak, and set the stage for what comes next.
The preferable cone
The last cone on the diagram is created by the group. This is the ‘preferable’ cone, and represents what the group feels is ideal—what they want to work towards over time given what they know. People will bring their experience and project goals with them, so it makes sense to get a diverse group involved.
The diagram can be used to:
- have a conversation about uncertainty and how it relates to goal(s)
- talk about ways to perform experiments/test hypotheses with differing levels of risk tolerance or perceived ROI, and how that tracks within the different cones as time goes on
- characterize how likely you think something is to happen (this can be internal, like a new hire or a technical breakthrough, or external, like who wins an election or whether there will be a recession)
- start to think about relationships or proximity between events; this often manifests as a tree-like graph growing to the right
- discuss resiliency and factors over which the team has little to no control
The end result of the exercise is often a bunch of notes positioned on the diagram (to capture their likelihood and corresponding time), with lines connecting some of them. Will it be a cone? Likely not!
As it is an exercise in foresight, push people to think farther out than they might be comfortable with; we’ve been conditioned to think in days and weeks, when we can benefit from thinking in months and years. It is better to go too far out and then reel yourself back in than not go far enough.
This diagram asks people to consider likelihood and time both defensively (e.g., how might we react if a competitive product emerges in two months?) and offensively (e.g., should we be conservative or swing for the fences?). It is a useful diagram to have you in your back pocket because of the unique framing it presents.
Let me know if you give this diagram a try and how it went for you.
References
Bleecker, J. (2023). It’s time to imagine harder: The reader’s guide to the manual of design fiction. Near Future Laboratory.
Bleecker, J., Foster, N., Girardin, F., Nova, N. (2022). The manual of design fiction. Near Future Laboratory.
Covert, A. (2014). How to make sense of any mess. (n.p.)
Dunne, A. and Raby, F. (2013). Speculative everything: Design, fiction, and social dreaming. MIT Press.
Gray, D. (2023). Visual frameworks: A language of patterns. [Card deck]. Self published.
Kirby, D. (2010). The Future is Now: Diegetic Prototypes and the Role of Popular Films in Generating Real-world Technological Development. Social Studies of Science, 40(1), 41-70. https://doi.org/10.1177/0306312709338325
Mitrovic, I., Auger, J., Hanna, J., Helgason, I. (2021). Beyond speculative design: Past - present - future. SpeculativeEdu.
Near Future Laboratory. (2022, June 21). What Is Design Fiction? [Video]. YouTube. https://www.youtube.com/watch?v=t_UT78JOauM
Robinson, P.A. (Director). (1992). Sneakers [Film]. Universal Studios.
The work kit of design fiction. [Card deck]. (2023). Near Future Laboratory.